Taming the Transformation Cost Beast
Understanding IT Cost Overruns and Their Impact on Decision-Making
[Reading Time: About 9 minutes]
Have you ever wondered why many IT projects blow their budgets and fall behind schedule? You’re not alone. IT project cost overruns consistently trouble both public and private sectors, impacting productivity, efficiency, and trust in digital transformation.
In this week’s post, we’ll explore groundbreaking research led by Bent Flyvbjerg from Oxford University (Flyvbjerg, 2022), which should change how we approach IT projects. The findings from Flyvbjerg’s research challenge our conventional assumptions, offering a clearer understanding of the true character of cost overruns. From this, we can reveal important lessons on how to improve the way we manage these projects.
The Perplexing Problem of IT Project Cost Overruns
IT project cost overruns have long been a challenge for organizations, especially in the public sector. With so much on the line, there’s tremendous pressure to complete them on time and within budget. Although we’re all aware of this issue, the frequency and scale of cost overruns still manage to catch us off guard.
We’re going to explore the subject of cost overruns. To begin with, let’s define it simply: A cost overrun occurs when expenses exceed our expectations.
This naturally raises another crucial question: How do we forecast and estimate potential costs? While this is an intriguing subject, we won’t delve into the specifics in this discussion. Instead, let’s focus on what research reveals about cost overruns.
Before we dive deeper, we need to take a moment to understand two statistical concepts: normal distributions and power law distributions. It’s not often that my background in math and statistics intersects with my work in service transformation, but I promise to make it as accessible and engaging as possible for everyone.
Understanding the Normal Distribution and Its Limitations
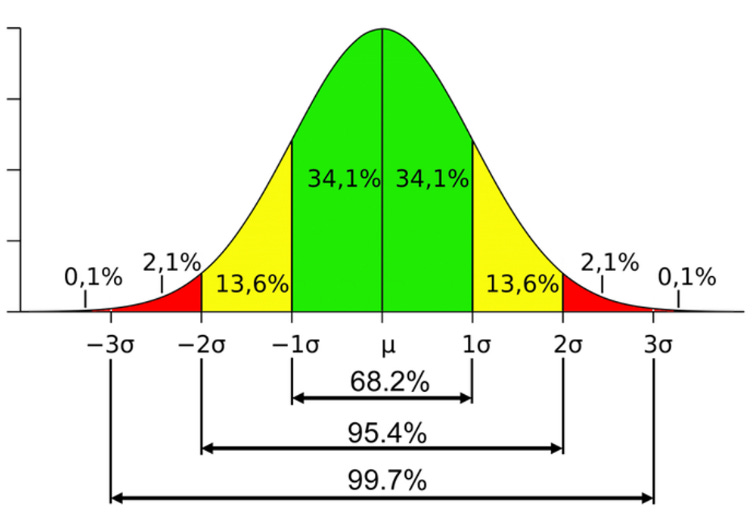
A normal distribution, also known as a Gaussian distribution or a bell curve, is a statistical concept representing the likelihood of events or values occurring. Imagine a graph with a bell-shaped curve, where the highest point is in the middle, the curve is symmetric and descends as you move away from the center on either side.

A normal distribution has two parameters:
The mean (μ) is the average value. It is the most likely value, and it’s at the peak of the curve.
The standard deviation (σ) tells us how wide the curve is, meaning how spread out the data are.
In a normal distribution, most data points cluster around the mean, and as you move further from it, you’ll find fewer data points. We often refer to normal distributions as "thin-tailed," meaning the probability of an event or value being far from the center (in the tails of the bell curve) is quite low.
For instance, the diagram above shows that there’s only about a 4.6% chance (100%- 95.4%) that something will fall outside of two standard deviations from the mean. For three standard deviations, that drops to only about a 0.3% chance.
We often use a normal distribution to model the potential cost of a project. In this scenario, the horizontal axis represents a cost, and the vertical axis represents the likelihood of that cost. As a result, the peak of the bell curve is the most likely cost. Costs to the right indicate higher estimates with diminishing probability, while those to the left are lower with diminishing probability.
Looking at the diagram above, you can also see that the mean (the peak) describes the 50th percentile for costs. This means there’s a 50% chance that the actual cost will be less than or equal to the average cost at the peak. When budgeting for a project, we might not simply take the center value, since there’s a 50% chance that our cost might be higher. Instead, we could choose a larger starting point and/or create a contingency based on our tolerance and risk appetite. For example, if we took 2σ as our contingency, we’d account for almost 98% of all possible costs if costs were distributed as normal distributions.
Here’s an interesting revelation: Flyvbjerg and his team of project management experts discovered that IT project cost overruns (i.e., the right side of the potential cost curve) do not follow normal distributions!
Uncovering the True Nature of IT Project Cost Risk
The researchers analyzed 5,392 IT projects and discovered that the distribution of cost overruns wasn’t normal or near-normal as previously assumed. Instead, their findings showed a "fat-tailed" power law distribution.
Before we get to those implications, let’s take a moment to understand what a power law is and why it’s significant.
The power law distribution and its difference from a normal distribution
Understanding power law distributions is essential for grasping the reality of IT project cost overruns. Like a normal distribution, they indicate how often certain events or values occur. However, their shape is notably different.
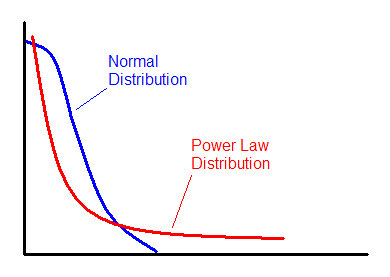
Take a look at this sketch comparing one side of a normal distribution to a power-law distribution:

Notice the tail: the tail of the power law is much "fatter" than that of the normal distribution. This means that extreme events happen more frequently than in a normal distribution, but it also has other implications as well.
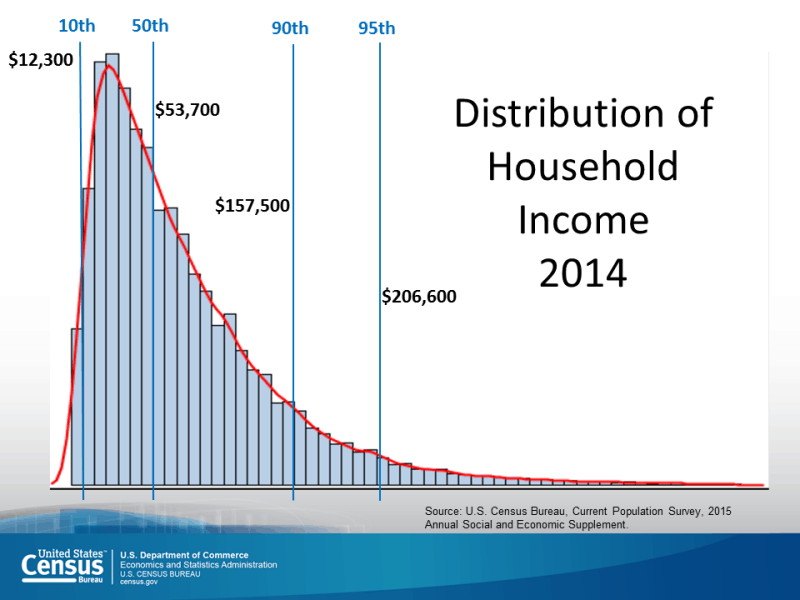
Here is an example of what this does to our nice symmetric distribution. Below are data showing the distribution of household income in the US in 2014:

Uncovering Hidden Risks
Notice how the right side of the plot is stretched out and doesn’t decay as quickly as the left side. Additionally, observe that the 50th percentile is now to the right of the most likely value (the peak).
If we were to use this shape of curve as the basis for estimating our project cost and contingency, we would arrive at significantly different numbers compared to using a normal distribution!
In the Annex at the end of this article, I give an interesting thought experiment on what our world might look like if human heights were distributed using a power law rather than the normal distribution that we observe to highlight how different these two assumptions are.
The research and its findings highlight three crucial insights:
We should use a power-law assumption instead of a normal distribution. Relying on a normal distribution results in incorrect estimations, causing underestimation of potential costs and associated risks.
We often severely underestimate the potential and severity of extreme cost overruns. Flyvbjerg’s research demonstrates that about 18% of IT projects fall into the tail of the distribution, and those experience an average cost overrun of a staggering 447%! (Flyvbjerg, 2023)
Research unveils the fascinating concept of self-organized criticality and interdependency within IT systems, first introduced by Herbert Simon. The complex interplay between interdependent subsystems in large systems can result in unexpected outcomes, such as the fat-tailed distribution observed in IT project cost overruns (Simon, 1991). Employing robust analytical methods and collecting sufficient data when forecasting IT projects is crucial for uncovering hidden patterns, better understanding the challenges, and identifying risks.
These findings emphasize the need to adjust our approach to IT project risk management, which can lead to more accurate budgeting, enhanced risk management strategies, and, ultimately, more successful IT project outcomes. Below, I offer five lessons on how we can do this.
Lessons Learned and Implications for Public-Sector IT Transformation Initiatives
1. Embrace the power law distribution:
Recognizing that IT project cost overruns follow a power law distribution, public-sector organizations should recalibrate their risk management approaches to account for the higher likelihood of extreme overruns. This may involve reevaluating budgetary allocations, contingency plans, and risk mitigation strategies to better prepare for potential challenges.
2. Invest in high-quality planning and risk management
Given the inevitability of extreme cost overruns, it’s crucial for public-sector organizations to prioritize high-quality planning and risk management processes. It’s like the old saying goes, ‘Failing to plan is planning to fail.’ We need to invest in top-notch planning and risk management to navigate the complexities of IT projects. This includes conducting thorough risk assessments, using experimentation as part of planning, identifying potential sources of interdependency and self-organized criticality within IT systems, and establishing robust monitoring and control mechanisms to track project progress and mitigate risks.
3. Adopt a proactive approach to risk identification and mitigation
Let’s get ahead of the game and tackle risks head-on, so we can keep our IT projects on track and deliver the results our citizens deserve. This means continuously scanning the project environment for potential risks, analyzing their potential impact on the project, and taking preventive measures to mitigate or avoid those risks. Regular risk reviews and assessments should be integrated into the project management process to ensure that risks are identified and addressed in a timely manner.
4. Foster a culture of learning and adaptation
To effectively navigate the challenges of large IT transformation initiatives, public-sector organizations must foster a culture that values learning, adaptation, and continuous improvement. We're all in this together, so let's learn from each other’s experiences and build a public sector that's agile, innovative, and ready to tackle the challenges of the digital era. Encourage project teams to learn from past experiences, both within the organization and from external sources, and incorporate those lessons into their planning and risk management efforts. This mindset will enable organizations to build resilience in the face of uncertainty and better adapt to the complex and dynamic nature of IT projects.
5. Emphasize communication and stakeholder engagement
Engaging stakeholders throughout the project lifecycle is essential to managing risks and expectations. Transparent and open communication can help to build trust, facilitate collaboration, and ensure that potential issues are identified and addressed early on. Public-sector organizations should invest in developing strong communication channels and actively involve stakeholders in project decision-making processes.
So there you have it – by embracing these insights and working together, we can turn today’s IT project challenges into the building blocks of a brighter future for the public sector.
Wrap up
Recognizing the true nature of IT cost risks opens new doors to more effective planning and management. If we prioritize high-quality planning, risk management, and fostering a culture of learning and adaptation, we can minimize the impact of cost overruns on large IT transformation projects.
So let’s continue to push beyond the status quo and lead public-sector transformation with the valuable lessons we’ve uncovered.
Annex: An interesting thought experiment - human height
Human height can be modelled by a normal distribution. What I want to show you is how extremely different the world would be if, instead, they were modelled after a power law, but the average height was the same.
Today, the average male height in North America is about 5 foot 10 inches, with a standard deviation of 2.95 inches. Most individuals have heights close to this average, while much fewer people are exceptionally short or tall. Using these numbers:
One SD is 5ft 7in on the short side, and 6ft 1in on the tall side; about 68% of North American males fall in this range.
Two SD is 5ft 4in on the short side, and 6ft 4in on the tall side; about 95% of all North American males fall in this range.
In fact, Robert Wadlow from the US, the tallest person ever recorded, stood 8 feet 11 inches tall, making him only about 55% taller than the average North American (and a crazy outlier at about 12.5 standard deviations taller than today’s average!).
Now, let’s imagine a world where human height follows a power distribution rather than a normal distribution:
[C]onsider a world where the heights of Americans were distributed as a power law, with approximately the same average as the true distribution (which is convincingly normal when certain exogenous factors are controlled). In this case, we would expect nearly 60,000 individuals to be as tall as the tallest adult male on record, at 2.72 meters. Further, we would expect ridiculous facts such as 10,000 individuals being as tall as an adult male giraffe, one individual as tall as the Empire State Building (381 meters), and 180 million diminutive individuals standing a mere 17 cm tall (Clauset, 2007).
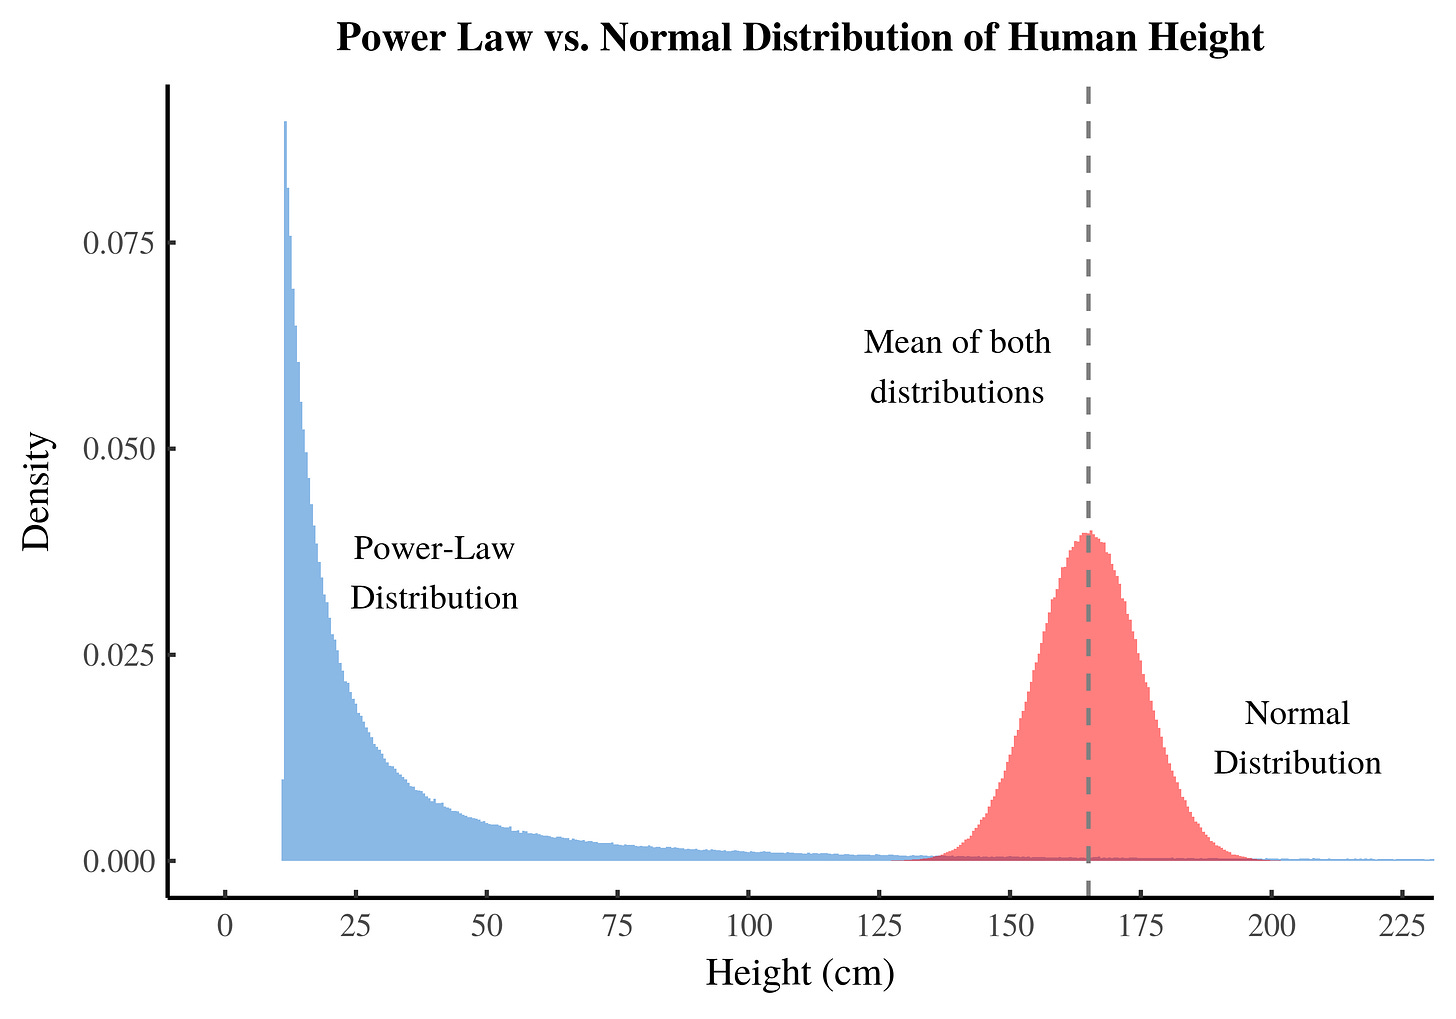
Here’s an example of what this would look like:

In this world, most people are incredibly short—under 10 inches tall! You might think the average height would be much lower than in our world, but surprisingly, it’s the same.
How could that be?
The answer lies in the fact that, in this world, there are a few rare individuals who are unbelievably tall, towering over others like trees or even reaching heights similar to Mount Everest. While these giants are extremely rare, their incredible height pulls up the average for the entire population.
Remember, power-law distributions have a “fat tail” that dies off slowly, allowing for the occurrence of these extreme values. Even though they are rare, they still raise the average of the entire distribution. This results in a scenario where, in our hypothetical world, over 90% of people are considered to be of ‘below-average’ height!
If someone in this fictional world tries to estimate heights using a normal distribution, they would be significantly underestimating the occurrence of extreme heights, leading to incorrect predictions; they’d be surprised every time they saw someone as tall as a giraffe… over and over and over again…
This is what we’re inadvertently doing with IT costs in our world.
REFERENCES
Clauset, A., Young, M., & Gleditsch, K. S. (2007). On the Frequency of Severe Terrorist Events. Journal of Conflict Resolution, 51(1), 58-87.
Fix, Brad. (2019). Visualizing Power-Law Distributions. Economics from the Top Down. Retrieved from the Economics from the Top Down website: https://economicsfromthetopdown.com/2019/04/25/visualizing-power-law-distributions/
Flyvbjerg, B., Budzier, A., Lee, J. S., Keil, M., Lunn, D., & Bester, D. W. (2022). The Empirical Reality of IT Project Cost Overruns: Discovering A Power-Law Distribution. Journal of Management Information Systems, 39(3), 607-639.
Flyvbjerg, B., & Gardner, D. (2023). How Big Things Get Done: The Surprising Factors that Determine the Fate of Every Project, from home Renovations to Space Exploration and Everything in Between. Signal.
Simon, H. A., & Klir, G. J. (1991). The architecture of complexity (pp. 457-476). Springer US.


